Map Genres: What Types of Maps are Included in the ARGO Portal?
The American Revolutionary Geographies Online (ARGO) portal contains a digital collection of maps and related graphic images from various libraries, archives, and map collections documenting North America’s geography from 1740-1800. By including a wide range of visual materials, the portal provides an unparalleled resource for researching and understanding the spatial components of America’s journey for independence and founding a new nation.
The maps selected for ARGO depict all or parts of the broad geographical area extending from Canada through the original thirteen British colonies to the West Indies. This expansive geographical area encompasses all of Britain’s North American colonies. It gives the basis for contextualizing Britain’s commercial interests and political conflicts with its European competitors in claiming and controlling territory within the continent during the last half of the eighteenth century.
This portal includes both printed and manuscript maps, along with related graphics. Printed maps were the most widely circulated maps during this period, while manuscript maps were prepared for more limited audiences. The manuscript maps range from quickly drawn pencil sketches to finely hand-drawn maps completed with ink and watercolors.1
The individual items in the portal encompass a wide range of map scales showing varying levels of detail. They range from small scale depictions (showing a small amount of detail, usually for a large geographic area) to large scale (showing a large amount of detail for much smaller geographic areas).2
Military Maps
The most obvious types of maps found in late eighteenth and early nineteenth century cartography are those relating to military activity. There are three generally accepted categories of military maps: intelligence gathering and operational maps, campaign and battle maps, and fortification plans and maps (Brown 2020, Ehrenberg and Morgan 2020, Harley 1978, Hodson 2019).
Intelligence Gathering and Operational Maps
Intelligence gathering and operational maps are generally manuscript in format and provide the broadest geographical coverage. Intelligence gathering maps were prepared to assist commanding officers in forming a mental image of the physical topography and settlement geography of the area in which the troops would be operating. These maps range from hastily drawn, small-scale reconnaissance surveys of broad areas to fairly detailed topographic surveys. The former were based on rough measurements and visual sightings while the latter were based on precise measurements prepared during long interludes between military engagements. In addition to the intelligence gathering activity, there are also maps recording actual campaign routes and encampments.
Detail from Charles Blaskowitz’s 1777 map A plan of New York Island … featuring the movements of locations of British forces
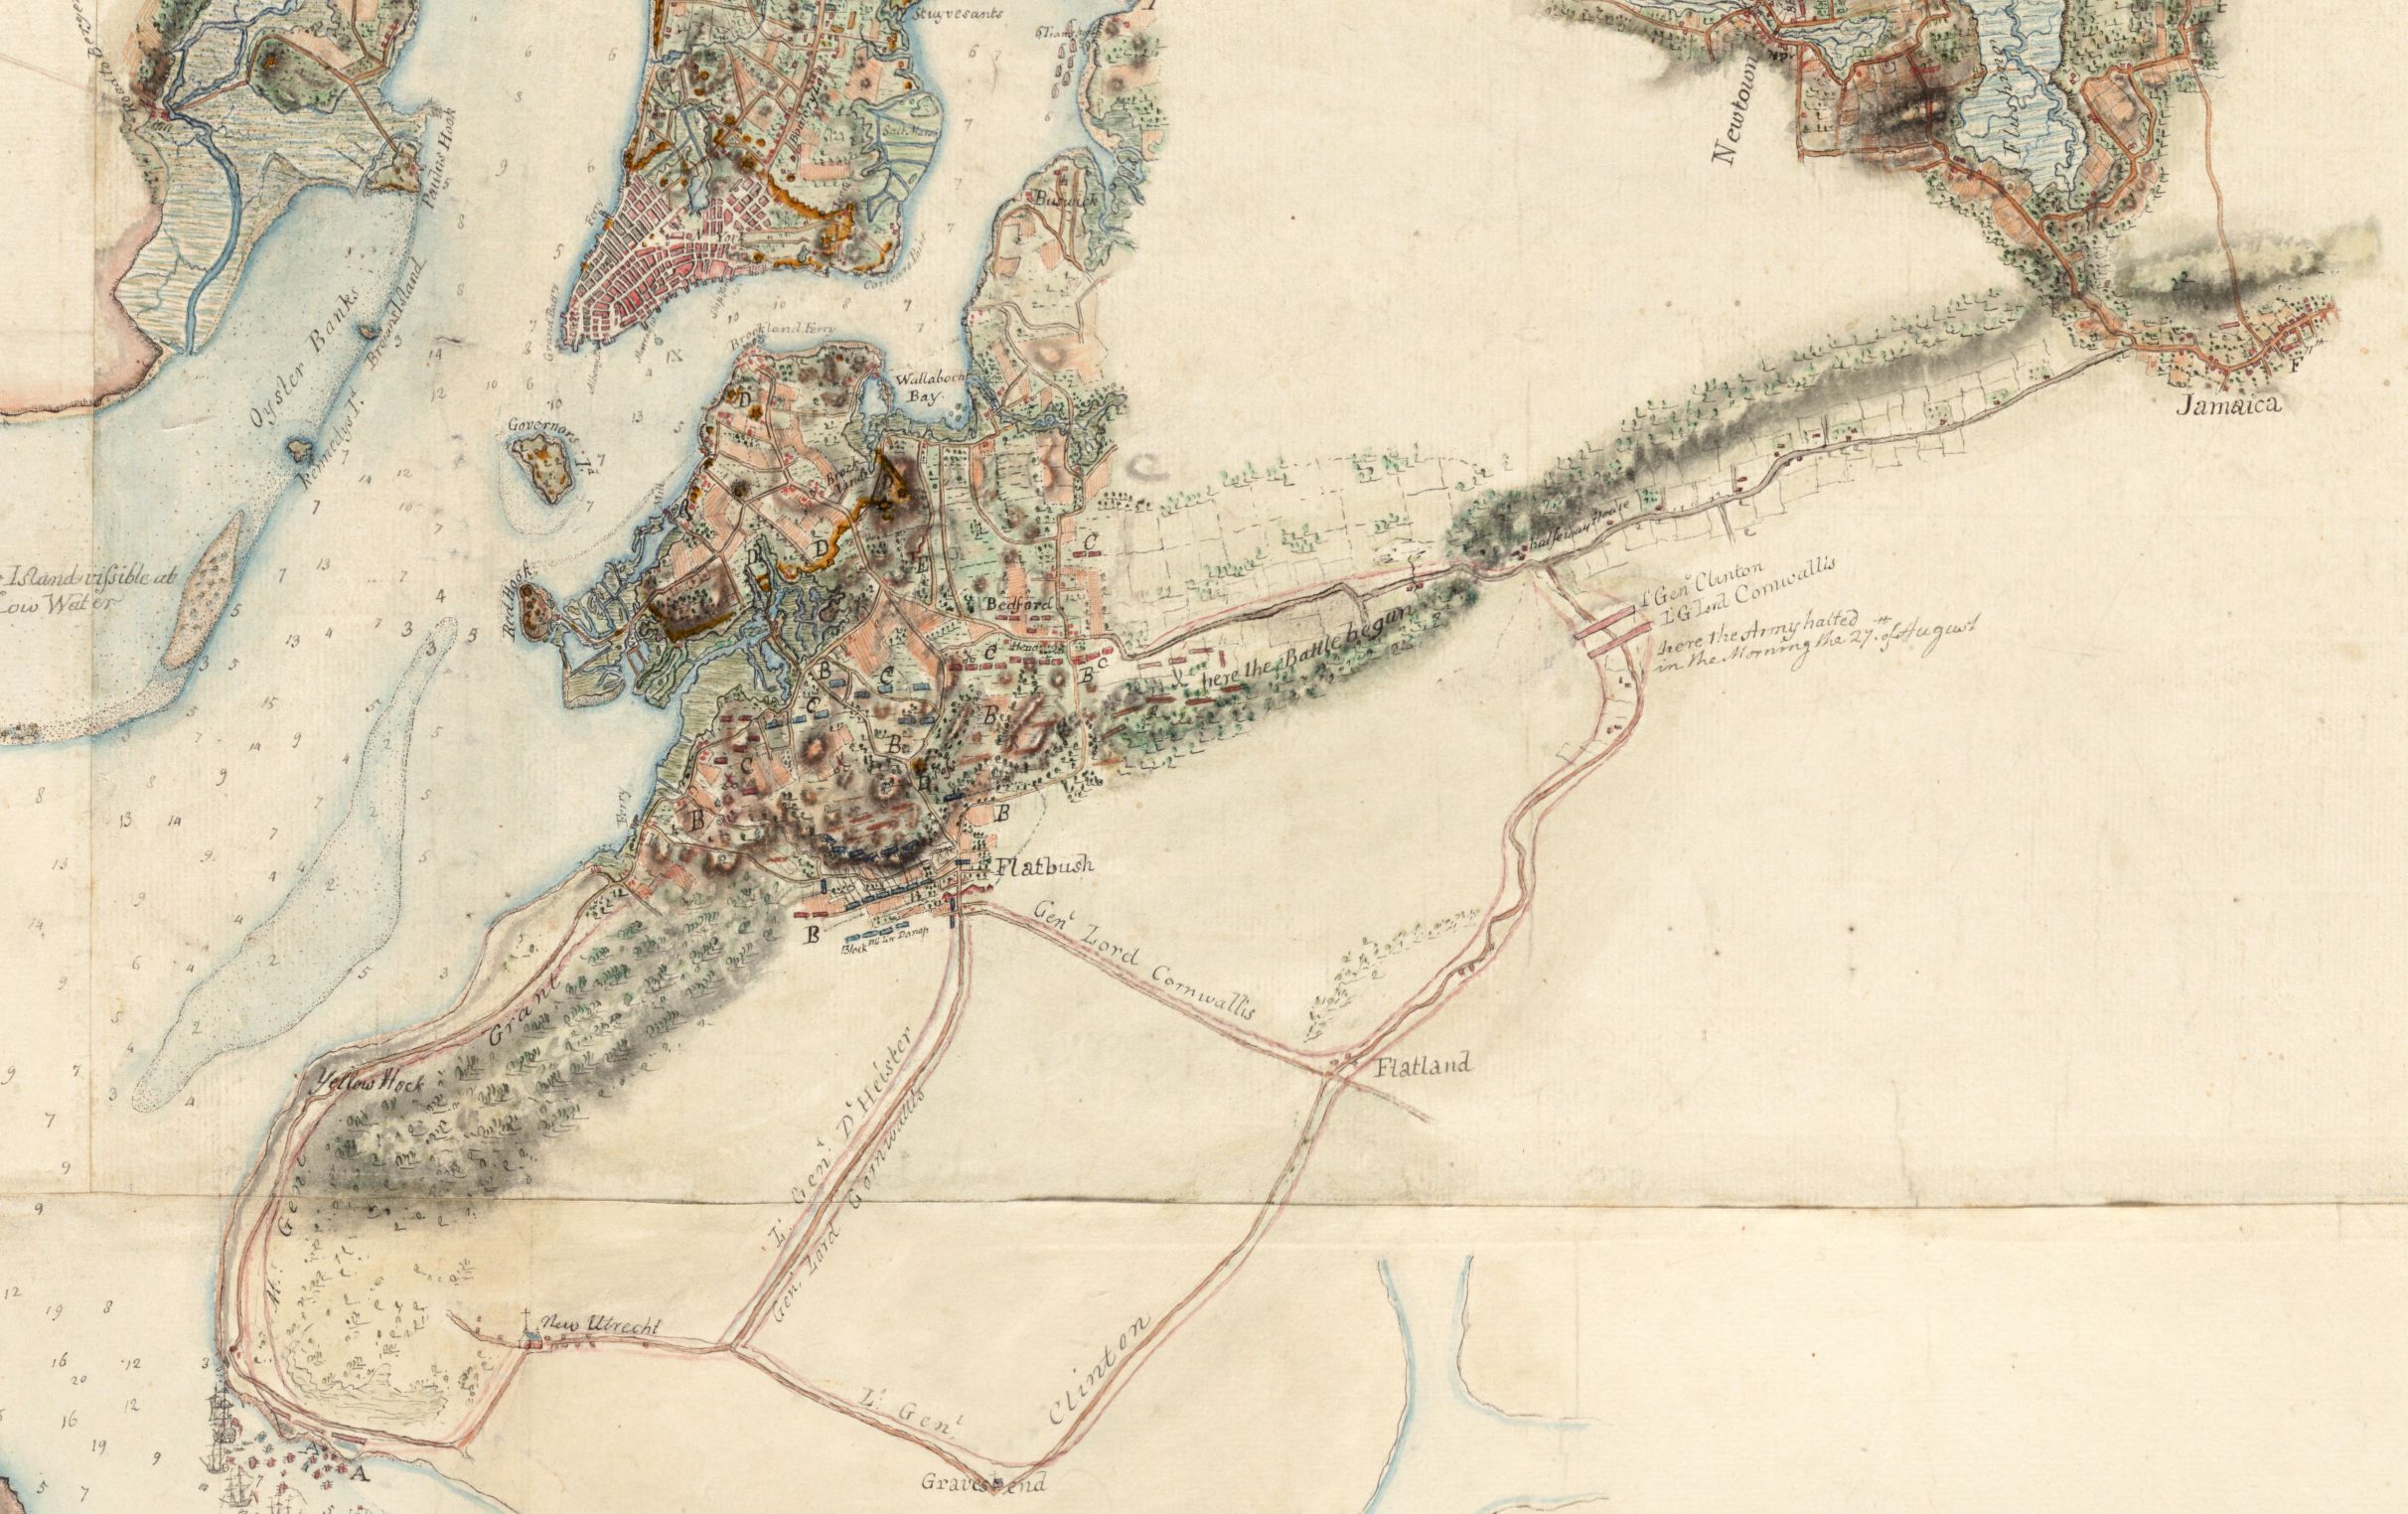
Campaign and Battle Maps
Campaign and battle maps show the actual position of troops during a campaign or individual battle (Dunnigan 2019a). A few examples of pencil drawings compiled during the battle or shortly thereafter have survived. However, the vast majority of battle maps (constituting the largest number of military maps) were prepared after a battle based on officers’ official reports (Nebenzahl 1975). These maps were mostly published in London, but also other European countries, for a record and analysis of the military actions. (Illustration 3)
Fortification Plans and Maps
The third type of military activity that is documented in the portal are maps and plans showing fortifications and related embankments, whether permanent or temporary (Dunnigan 2019b). Such graphics often incorporate plans that are primarily of architectural or engineering interest. Our selection, however, has focused on site or ground plans showing the footprint of fortifications and embankments in relation to surrounding terrain. While ARGO includes a selection of plans for major buildings, it generally does not include floor plans of individual structures or cross sections of embankments.
Administrative Maps
Other popular maps of the eighteenth century included government authorized maps or “Maps of Empire,” nautical charts, town plans and maps, and property surveys. Many of these maps were prepared with government authorization but published by a growing number of commercial firms. Such maps and other commercially published maps provided geographic information, not only for government and military officials, but for a growing audience with political, commercial, and general interests.
”Maps of Empire”
A large number of maps published in the third quarter of the century following the Seven Years’ War could be termed “maps of empire,” since they were prepared by authorization of the British Board of Trade (Edelson 2017, Johnson 2019a). Many were large-sized maps, published on multiple adjoining sheets, depicting a moderate amount of detail at intermediate and small scales. Some depicted the eastern portion of North America, showing European imperial claims. Others depicted individual colonies or several neighboring ones, as well as individual West Indian islands. Boundaries delimiting imperial claims or areas occupied by native peoples were often featured on these maps. In addition, maps of individual colonies depicted major towns, roads, county names or boundaries, and sometimes property boundaries (especially for the West Indian islands). After United States independence, state governments quickly authorized mapping projects of their respective jurisdictions. These maps also delineated county and township boundaries, as well as roads and major towns and cities.
Nautical Charts
Another important aspect of the British colonization of North America was mercantile trade based on maritime navigation. During the first half of the eighteenth century before the Seven Years’ War, there were scattered efforts to create navigational aids for North America. For example, there were numerous editions of the English Pilot, Fourth Part, which supplied sailing directions and small-scale charts for significant coastal areas and harbors. After acquiring the former French territories in Canada following the 1763 peace treaty, the British renewed efforts to chart the Atlantic Coast from Newfoundland to Gulf of Mexico. The resulting surveys were eventually published as the Atlantic Neptune by the time of Revolutionary War. While these charts provided navigational information for most of the eastern coast of North America, they also included fairly detailed topography for coastal and harbor areas (Hornsby 2019, Maeer 2019, and Maeer and Williams, 2019).
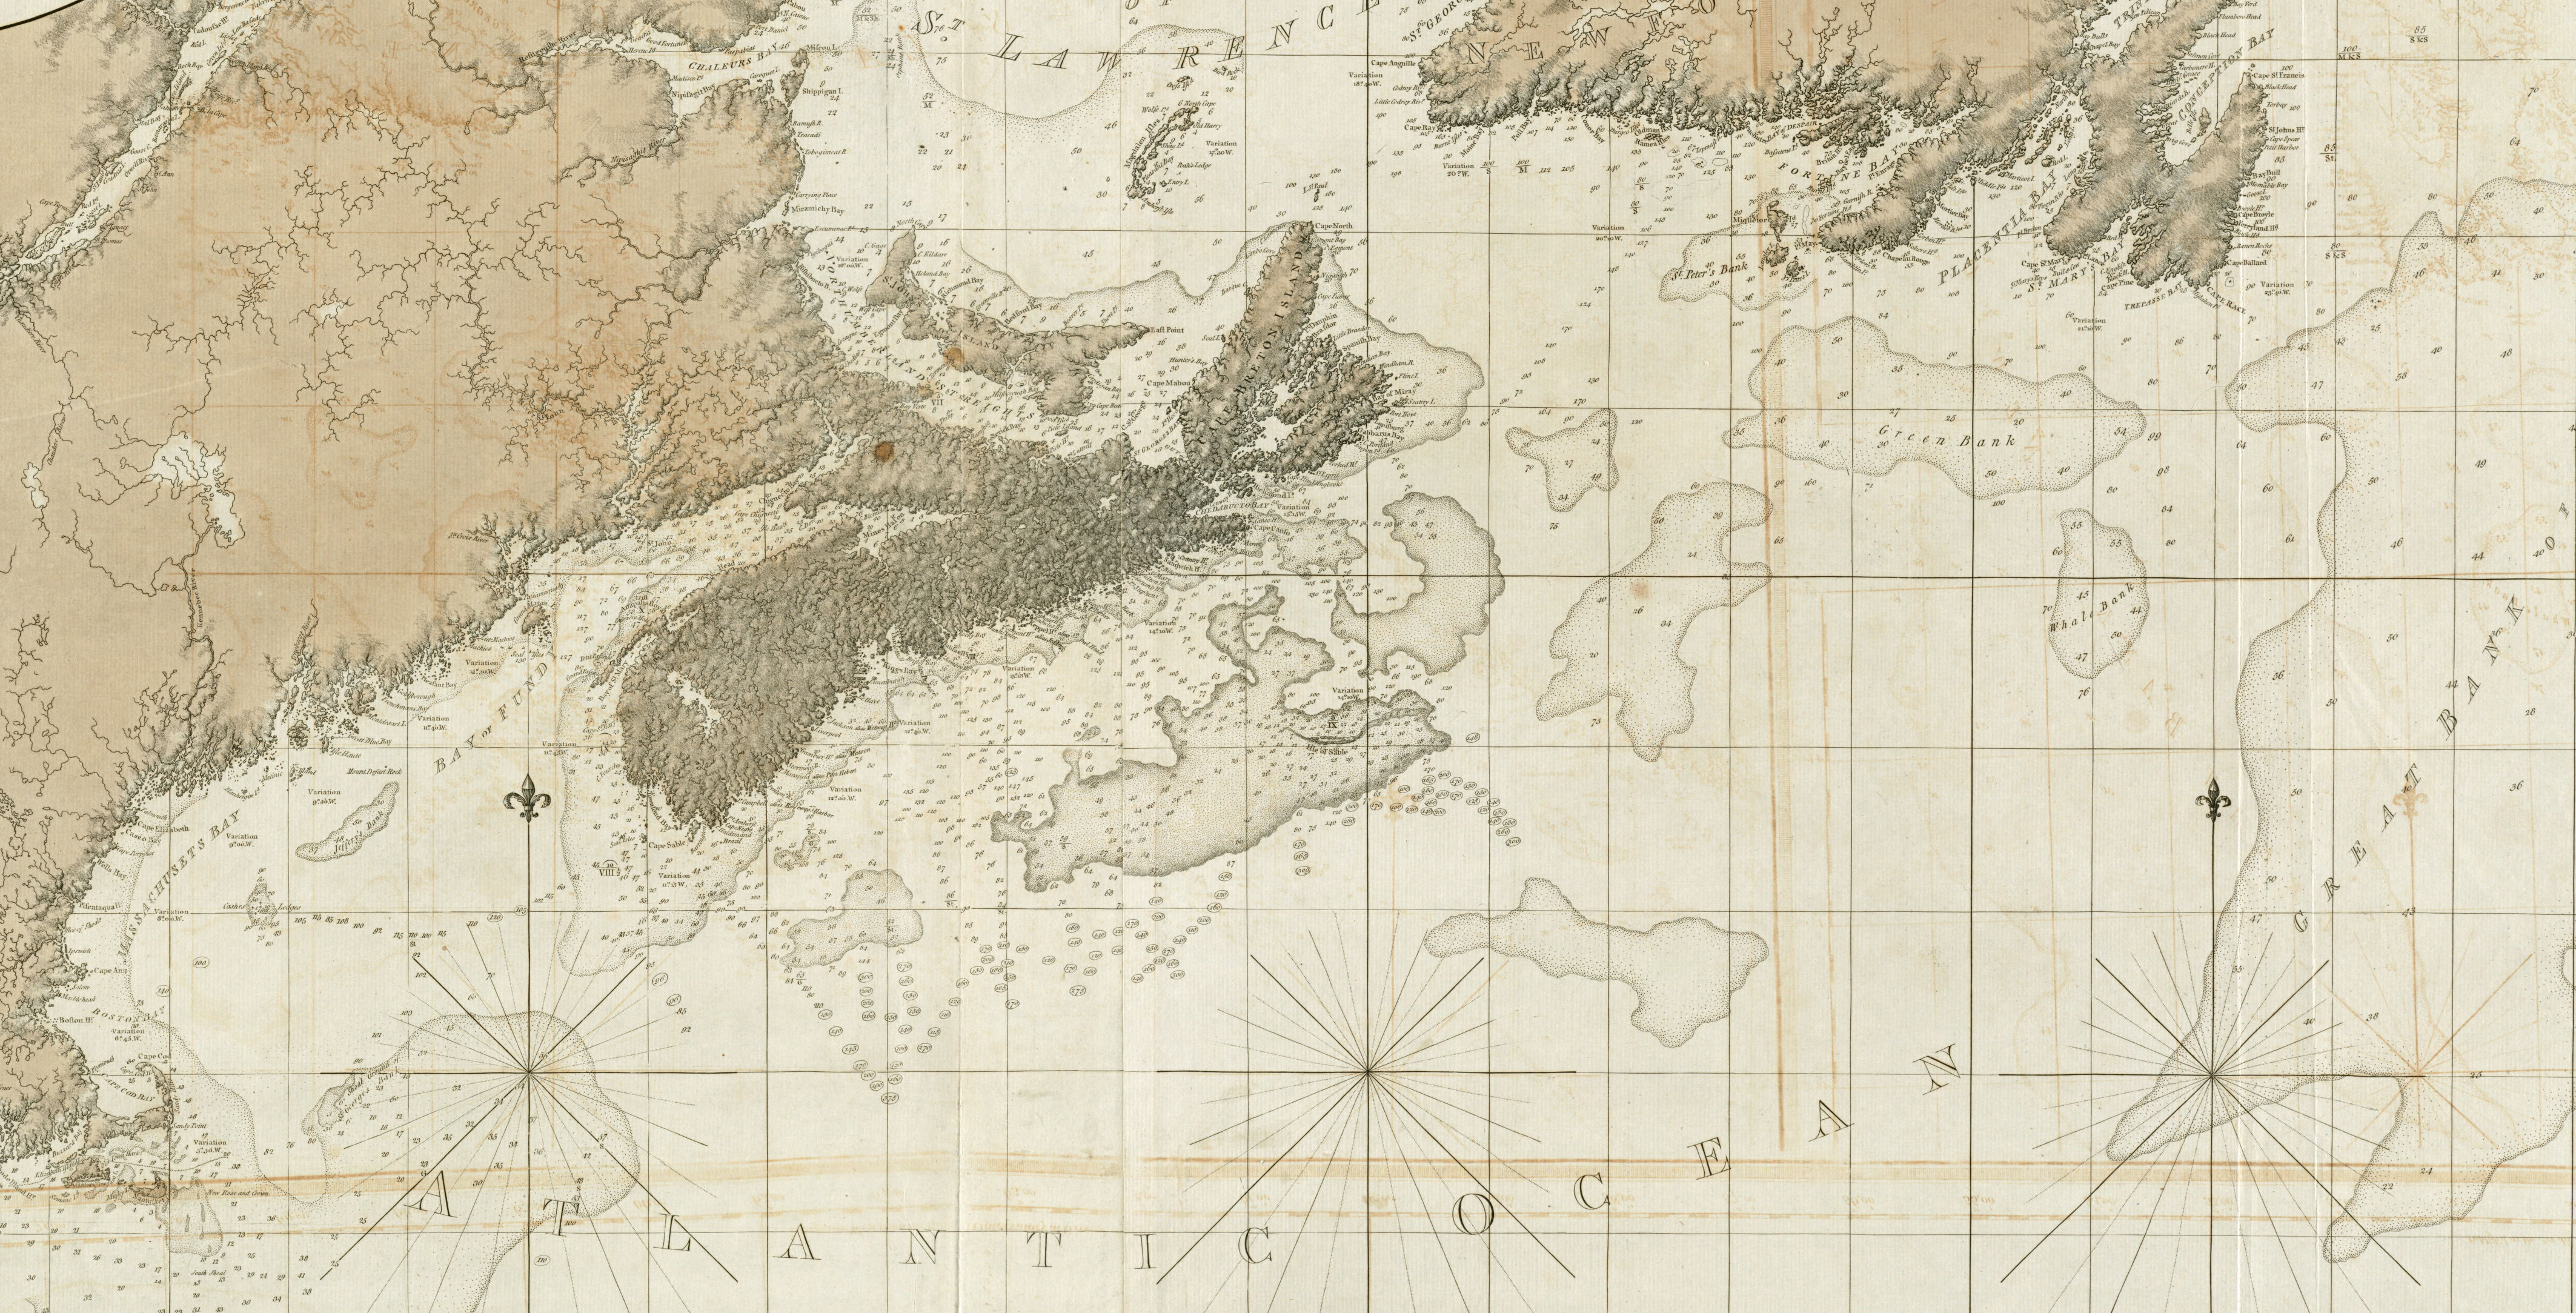
This 1780 map displays the coastline of New England and Canada, including navigational details like tidal depths and bottom information
Town Plans and Maps
Town plans and maps, many of which originated as part of government and administrative activities, constitute another distinctive map genre. These maps were drawn at large scales and often only in one or a few manuscript copies. They were used for planning the layout of a town, recording the sale of lots and property ownership, and promotional purposes. As cities such as Boston, Newport, New York, Philadelphia, Baltimore, Charleston, and Savannah emerged, commercial publishers issued printed editions showing the growth of these cities, focusing on street pattern, major buildings, and harbor facilities. Such geographic information would be useful for government, commercial, travel, and real estate interests (Grim 2019a)
Property Surveys
The portal includes a selection of documents pertaining to property surveys. These landownership records are generally large-scale manuscript survey plats recording the boundaries of individual properties. However, these plats occasionally present information about land use and settlement features on the property. The portal selection focuses on the later more informative plats, and those showing several adjoining properties, in order to provide evidence of broader settlement and economic patterns. An exception, however, are the property surveys performed by George Washington, documenting his surveying activities during the early years of his career. Property ownership, especially for larger land grants or manors, was often incorporated in the previously mentioned moderate scale “maps of empire” (Grim 2019b).
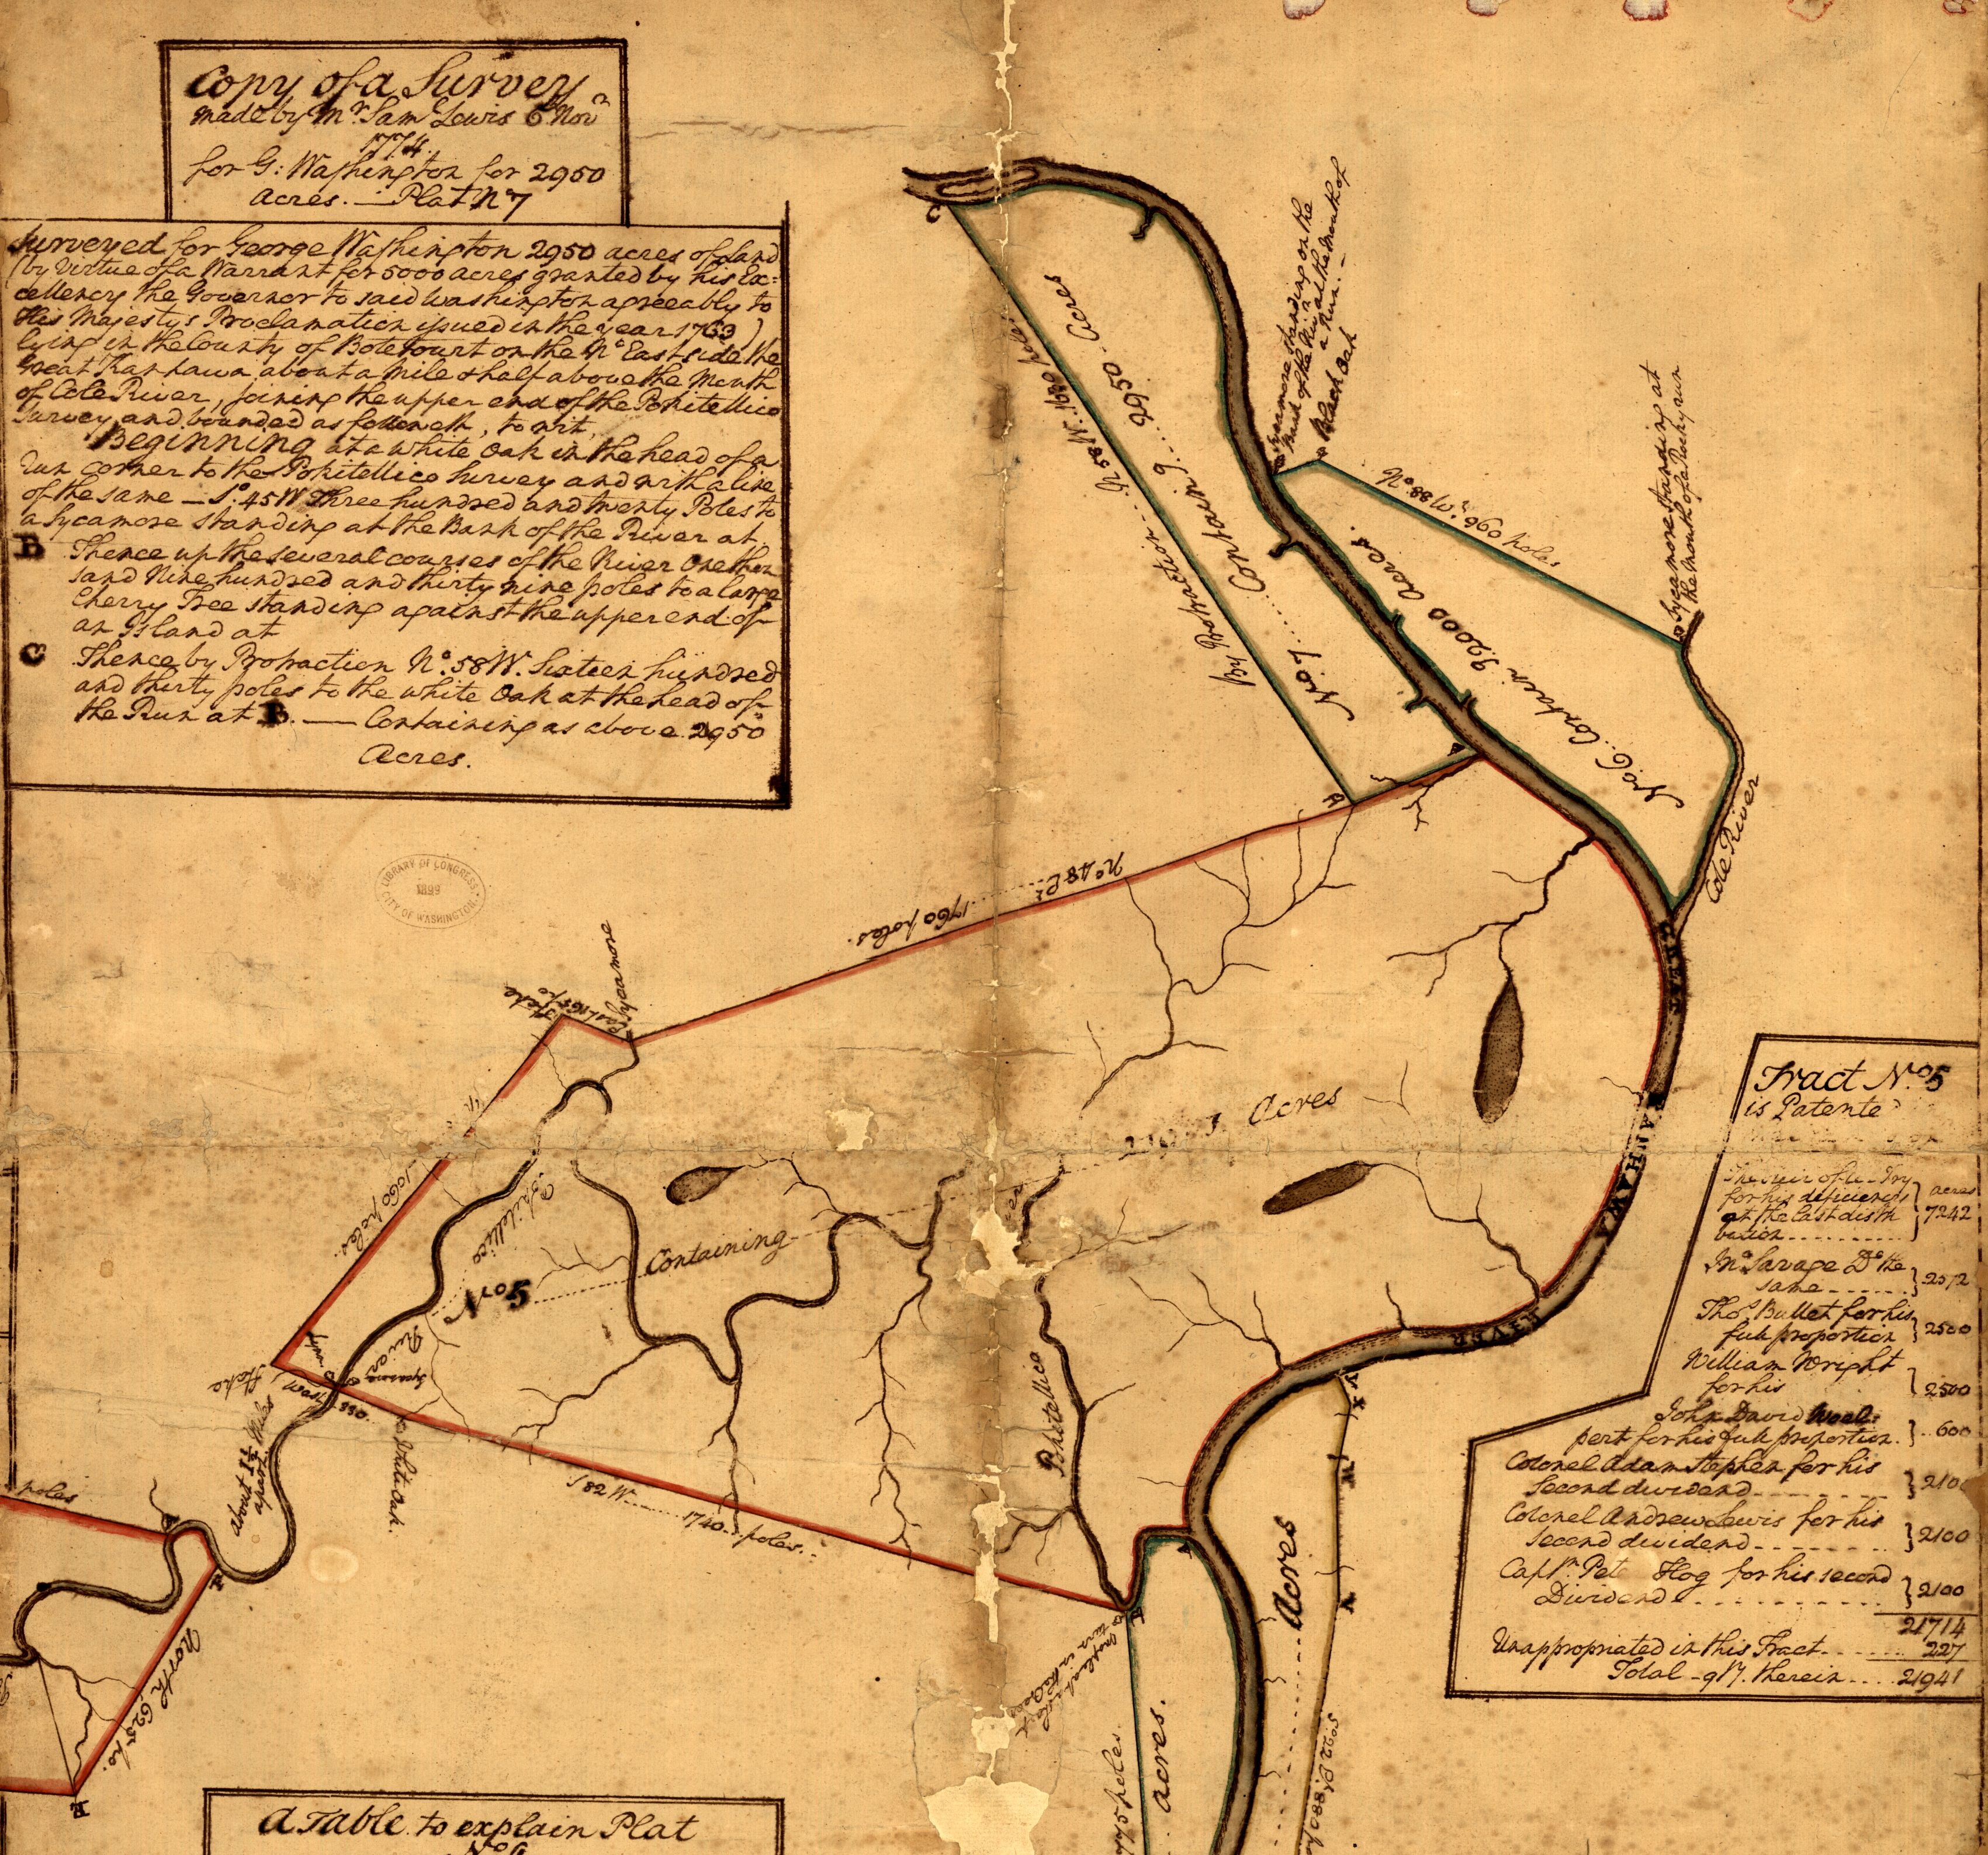
This section of a composite survey map, compiled by George Washington, displays various land divisions along the Kanawha River in West Virginia
Maps for a General Audience
A more miscellaneous grouping of graphics in the portal are small-scale and small size maps and related graphics intended for the general public. These graphics include journalistic and educational maps, thematic and pictorial maps, and landscape views. Although they provide generalized or limited information, they are a good resource for assessing the public’s perception and knowledge of geographical, military, and commercial boundaries
Journalistic and Educational Maps
Journalistic and educational maps were generally small in size and depicted a limited amount of information. What we label as journalistic maps today appeared as illustrations for articles published in eighteenth century newspapers or magazines. They provided the literate public with information about important locations or summary depictions of major battles and campaigns (Mayhew 2019). Educational maps, as we know them today, were prepared for inclusion in smaller sized atlases (such as quarto, octavo, or duodecimo), which appeared primarily during the last two decades of the eighteenth century. They served as basic reference tools for general or educational audiences illustrating the rudimentary geography of the United States and its individual states (Ristow 1997, Brückner 2017).
Thematic and Pictorial Maps
Thematic and pictorial maps were common during the nineteenth and twentieth centuries, but rarer in the eighteenth century. Thematic maps, which depict statistical data showing the spatial distribution of a single or several closely related sets of data, are very rare for the Revolutionary War period (Johnson 2019b, Delaney 2012). However, several unusual, but significant examples of thematic maps include a set of manuscript maps showing the number of British troops stationed in North America following the Seven Years’ War, as well as the first maps of the Gulf Stream. Similarly, pictorial maps, which gained wide popularity during the first half of the 20th century, were uncommon during the eighteenth century. Such maps creatively employ realistic or stereotypical representations as symbols for such features as people or structures. Two battle-related maps — one of the 1755 battle at Lake George and another of the opening battle of the Revolutionary War at Lexington and Concord — are excellent examples of pictorial maps.
Landscape Views
A final type of graphic that is not often included in discussions of eighteenth-century mapping are manuscript and printed views, whether of landscape or urban settings. While these are not technically considered maps, a selection appear in ARGO because they provide graphic information about the geographic landscape, particularly from a horizontal perspective (Cresswell 1975, Daniels and Bonehill 2019). Prepared for a variety of purposes, they are often found as manuscript sketches or drawings prepared to supplement reconnaissance mapping surveys or published views depicting individual battles and major towns or strategic locations.
References
Brown, R. 2020. Discovering Revolutionary War maps. The Portolan 108: 51- 63.
Brown, R. and P. Cohen 2015. Revolution: Mapping the Road to American Independence, 1755-1783. New York and London: W.W. Norton.
Brückner, M. 2017. The Mobilization of maps. In The Social Life of Maps in America, 1750 – 1860, 241- 310. Chapel Hill: University of North Carolina Press for Omohundro Institute for Early American History and Culture.
Cresswell, D. H. 1975. Views. In The American Revolution in Drawings and Prints: A Checklist of 1765-1790 Graphics in the Library of Congress, 129 - 237. Washington, DC: Library of Congress.
Daniels, S. and J. Bonehill 2019. Landscape, maps, and aesthetics. In History of Cartography, vol. 4, Cartography in the European Enlightenment, eds. Matthew H. Edney and Mary Sponberg Pedley, 720-727. Chicago: University of Chicago Press.
Delaney, J. 2012. First X, Then Y, Now Z: An Introduction to Landmark Thematic Maps. Princeton, NJ: Princeton University Library.
Dunnigan, B. 2019a. Battle map. In History of Cartography, vol. 4, Cartography in the European Enlightenment, eds. Matthew H. Edney and Mary Sponberg Pedley, 1010-1014. Chicago: University of Chicago Press.
Dunnigan, B. 2019b. Fortification plan. In History of Cartography, vol. 4, Cartography in the European Enlightenment, eds. Matthew H. Edney and Mary Sponberg Pedley, 1014 -1015. Chicago: University of Chicago Press.
Edelson, S. M. 2017. The New Map of Empire: How Britain Imagined America before Independence. Cambridge, Mass.: Harvard University Press.
Ehrenberg, R. and G. Morgan 2020. Mapping Mr. Madison’s war: American military cartography during the War of 1812. The Portolan 108: 7 – 46.
Grim, R. 2019a. Urban mapping in British America. In History of Cartography, vol. 4, Cartography in the European Enlightenment, eds. Matthew H. Edney and Mary Sponberg Pedley, 1572-1575. Chicago: University of Chicago Press.
Grim, R, 2019b. Property mapping in British America. In History of Cartography, vol. 4, Cartography in the European Enlightenment, eds. Matthew H. Edney and Mary Sponberg Pedley, 1175-1181. Chicago: University of Chicago Press.
Harley, J.B. 1978. The Contemporary mapping of the American Revolutionary War. In Mapping the American Revolutionary War, eds. J.B. Harley, Barbara Bartz Petchenik, and Lawrence W. Towner, 1-44. Chicago: University of Chicago Press.
Hodson, Y. 2019. Military cartography by Great Britain. In History of Cartography, vol. 4, Cartography in the European Enlightenment, eds. Matthew H. Edney and Mary Sponberg Pedley, 984-990. Chicago: University of Chicago Press.
Hornsby, S. 2019. The Atlantic Neptune. In History of Cartography, vol. 4, Cartography in the European Enlightenment, eds. Matthew H. Edney and Mary Sponberg Pedley, 132-133. Chicago: University of Chicago Press.
Johnson, A.J.C. 2019a. Administrative cartography in British America. In History of Cartography, vol. 4, Cartography in the European Enlightenment, eds. Matthew H. Edney and Mary Sponberg Pedley, 47-52. Chicago: University of Chicago Press.
Johnson, A.J.C. 2019b. Thematic mapping in Great Britain. In History of Cartography, vol. 4, Cartography in the European Enlightenment, eds. Matthew H. Edney and Mary Sponberg Pedley, 1377 - 1382. Chicago: University of Chicago Press.
Maeer, A. 2019. Maritime charting by Great Britain. In History of Cartography, vol. 4, Cartography in the European Enlightenment, eds. Matthew H. Edney and Mary Sponberg Pedley, 891-898. Chicago: University of Chicago Press.
Maeer, A. and A. B. Williams, 2019. The English Pilot. In History of Cartography, vol. 4, Cartography in the European Enlightenment, eds. Matthew H. Edney and Mary Sponberg Pedley, 393-396. Chicago: University of Chicago Press.
Mayhew, R.J. 2019. Public sphere, cartography and the. In History of Cartography, vol. 4, Cartography in the European Enlightenment, eds. Matthew H. Edney and Mary Sponberg Pedley, 1219 – 1223. Chicago: University of Chicago Press.
Nebenzahl, K. 1975, A Bibliography of Printed Battle Plans of the American Revolution, 1775-1795. Chicago: University of Chicago Press.
Ristow, W. W. 1997. Early American atlases and their publishers. In Images of the World: The Atlas through History, eds. John A. Wolter and Ronald E. Grim, 301- 329. Washington, DC: Library of Congress.
Footnotes
-
A large number of manuscript maps, many not previously illustrated, are included in Brown and Cohen, 2015. ↩
-
Map scales are usually displayed on the map as a representative fraction expressing the ratio between a unit of measure on the map with the same unit of measurement on the ground, or a simple verbal statement such as 1 inch on the map equals 1 mile on the ground ↩